Central Logger
It can be difficult to diagnose problems when an application is operating across multiple windows. Just using the Chromium debugger would require you to have many different debug windows open and mentally map the times of the logs.
To help you with troubleshooting and debugging tasks, we recommend that you use the Central Logger. It is the place to view the relevant logs, with accurate timing, across all components and desktop services.
Note: The Central Logger is not just for the devs. Anyone that runs Finsemble can access the logger and export the logs.
The Central Logger is very configurable, offering many settings for your specific needs and individual preferences. The settings of the Central Logger persist between sessions. The Central Logger indicates how many log messages are being currently displayed out of the total captured, or since the last time messages were cleared. Due to resource consumption, the Logger will only capture the last 100,000 log messages with the oldest messages being discarded.
Important: If you are capturing many log levels from many clients (for example, while debugging), the performance of your Finsemble application may be affected. Once debugging is completed, it's best reduce the logging levels to their default state.
Launching the Central Logger
To bring up the Central Logger, click on the Finsemble icon in the top left corner of the toolbar and pick "Central Logger" from the dropdown menu. Alternatively, you can also press Ctrl+Shift+L. The Central Logger is only available when the Finsemble is hosted from localhost.
Log view
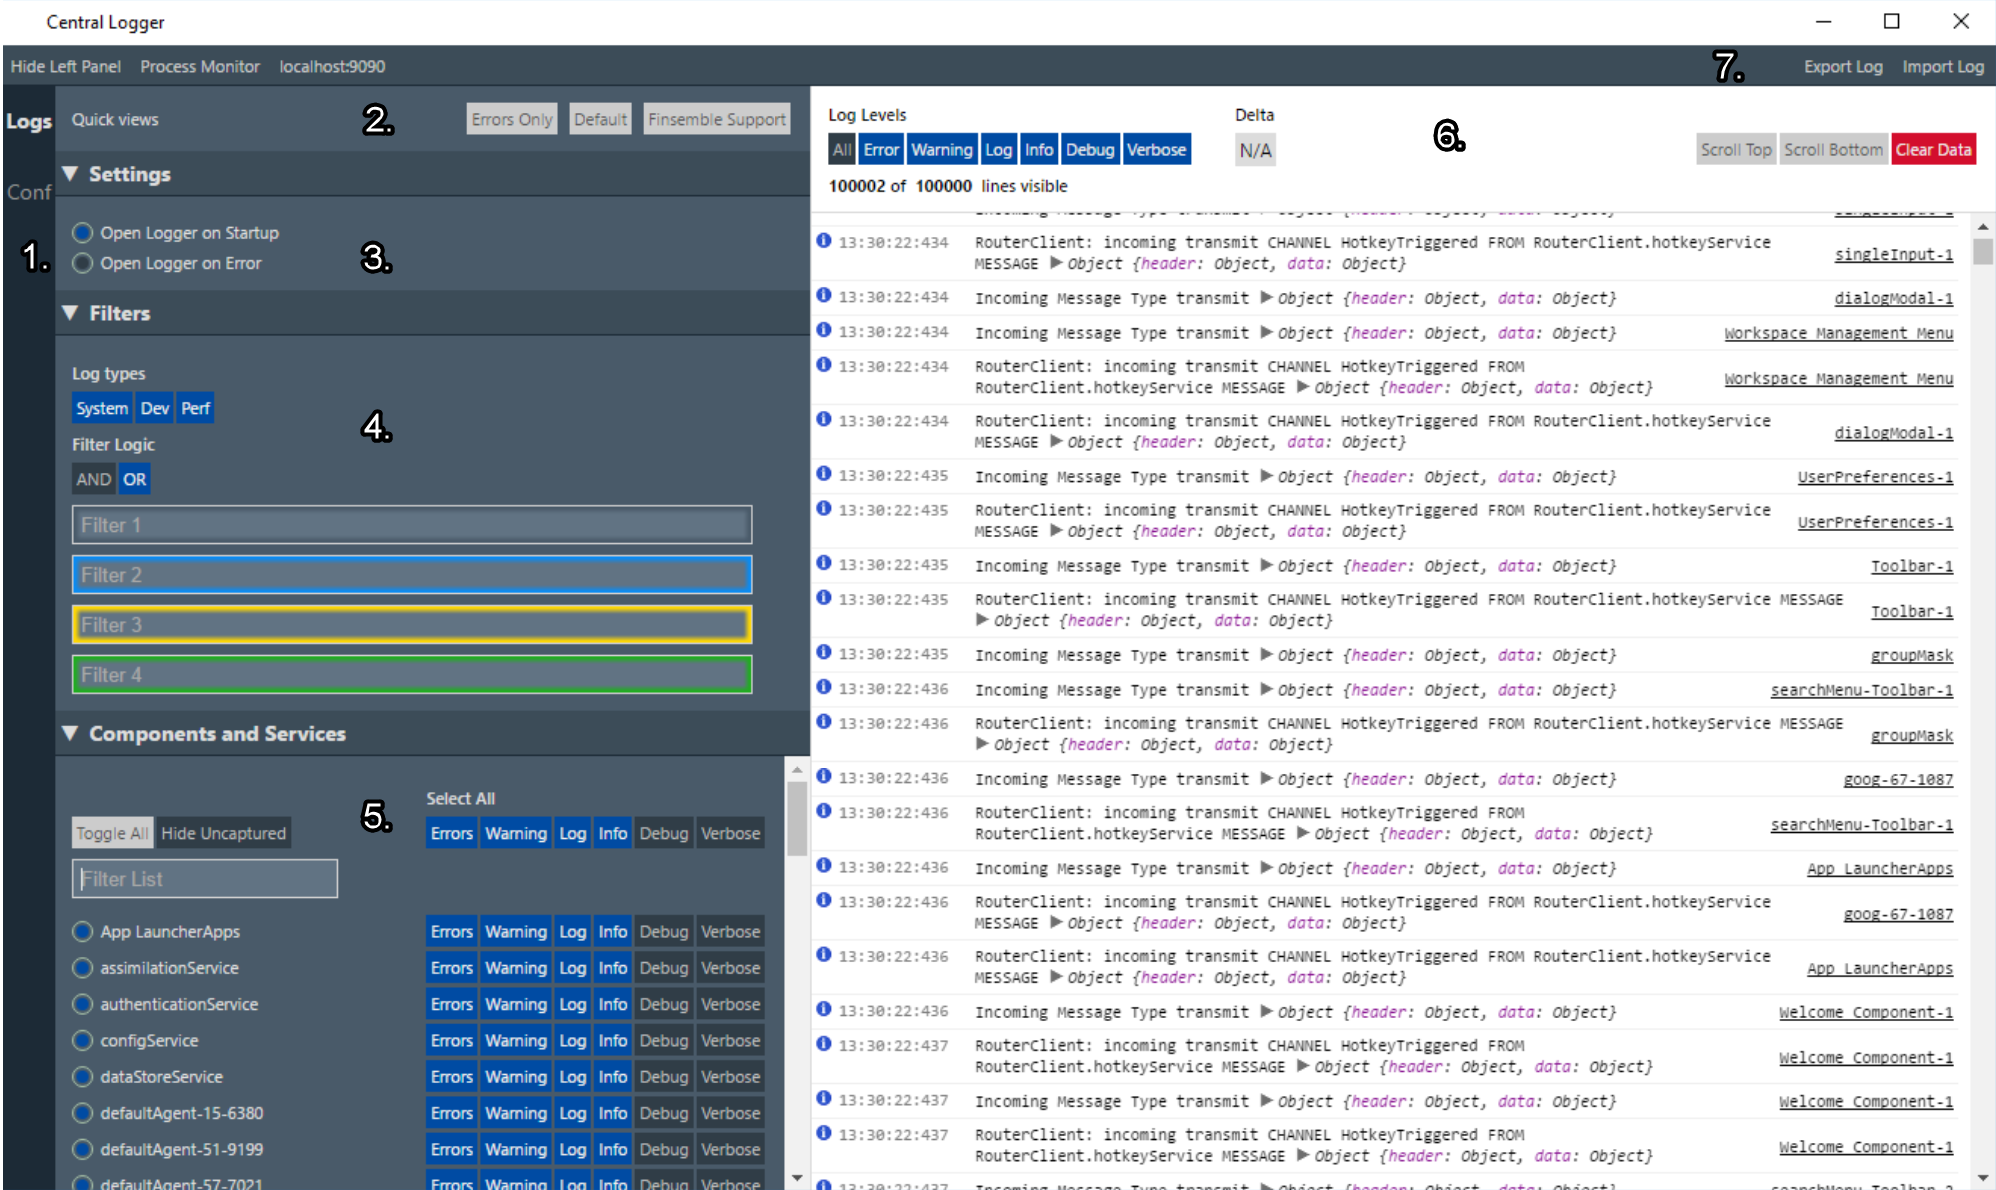
1. View changer
On the left side of the Central Logger window there are two links: Logs and Conf. Clicking either of these links will change the active view. The "Conf view" is a fully parsed, searchable (by using CTR+F) config for your application. The "Logs view" is a list of all of the logs that are coming in from the system.
2. Quick views
The logger has 2 panels The left one offers the quick views, and the right one displays the comprehensive logs view.
Use the “Quick views” buttons to toggle commonly used features on and off:
"Errors Only" sets the log levels to filter everything except for error messages.
"Default" sets the capture and log levels to their default state. By default, only error and warning messages are captured by the Logger, with the other message types (e.g., log, info, debug) disabled.
"Finsemble Support" toggles all capture and log levels on.
Important: This capture state can be resource intensive and may affect the performance of your Finsemble application. Because the Central Logger autosaves your capture settings, you will want to manually return the Central Logger to default settings after you have completed your debugging procedures.
You can hide the quick views panel if you need more screen area to see the log details. To do so, click "Hide left panel" in the upper left corner.
3. Settings
You can change the Central Logger's settings. You can set the logger to load at startup. You can set the logger to load when there's an error.
Typically, a developer would open the logger on startup, so that they can see exactly what's happening while developing. An end user doesn't need the logger on all the time, so in that situation you want to configure it to open only when there is an error.
Log types
Finsemble offers 3 log types: system, dev, and perf. You can choose one or any combination of these options. In general, the log type is defined by where the message is coming from. The system logs are mainly focused on messages coming from Finsemble, while dev and perf collect data from your own system. Use Perf for performance measurements.
4. Log filters
We have four filters to help you find and diagnose problems. You can connect them by using the logical AND or logical OR operations. To pick the operator you want click the appropriate box.
The filters don't support regexes, but they do support negation. To exclude a log, preface your search string with -. For example, to leave out every log dealing with a toolbar, put -toolbar into one of the filters. Negation filters don't follow compound logic. If a log has a negated string in it, that entire log will be filtered out of the view, even if it matches other filters.
5. Client list (components and services)
The lower left area of the Central Logger displays a list of Finsemble logger clients (that is, a newly created component or desktop service). Click the radio button next to client name to disable or enable that client's log capturing. When a client is terminated, they no longer appear on the client list, but corresponding log entries remain.
When multiple instances of a component belonging to a workspace can exist (e.g., many instances of a Salesforce window), Finsemble allocates a random ID to the name for uniqueness (such as "salesforceComponents-31-11566"). Otherwise, multiple components (e.g., a toolbar for each of your monitors) just have a counter for uniqueness (e.g., "searchMenu-Toolbar-2")
The client name "ChartIQ" refers to the Service Manager. It's rendered this way because of the way Finsemble is spun up.
Click a client name to bring up a Chrome Developer Tools window. This area has several controls that help you specify which entries you want to display:
- The "Toggle All" button switches between capturing all client's logs and capturing no client logs.
- The "Hide Uncaptured" button removes any client not capturing logs from the client list.
- The "Filter Client List" box is used to look specifically only for the client that you're attempting to debug.
- The "Default Capture State" buttons determines the granularity of the message captured. When a default capture setting is enabled, new clients capture log messages from their start so nothing is lost. You can capture Error objects such as
console.error,log.error,log.system.error, Warning, Log, Info, Debug, or Verbose messages.
6. Log list
The right area of the Central Logger displays the log messages generated by the client process. The log list consists of three columns. The left column details the timestamp—the time in milliseconds since the Finsemble application was started. Each timestamp is added when the corresponding log-function call is invoked, so it is accurate within the same client down to the microsecond range. However, timestamps must be calibrated by Finsemble for accuracy across component and service window boundaries (because of timer drift within Chromium), resulting in less precision when comparing timestamps across windows. The timestamp is precise enough at the millisecond level to correctly order/sequence all log messages.
The center column details the log messages themselves. The right column is the source (client) that captured the message. You can click the source to bring up a Chrome Developer Tools window.
At the top of this area, we have some buttons. The "Log Level" buttons filter the log list based on message type (Error, Warning, Info, Logs, Debug, Verbose). Click "All" to log all messages.
The Delta displays the timestamp difference in milliseconds between messages. To perform this calculation, click the first log line and then CTRL+click the second log line. The time difference is automatically displayed in the Delta field.
"Scroll Top" scrolls to the top of the log list. Conversely, "Scroll Bottom" scrolls to the bottom of the list.
"Clear Data" clears all the captured messages. After you clear the messages, they are lost unless you previously saved them using "Export Log to File."
7. Top level controls
At the top of the Central Logger window, there are several more useful buttons.
- The "Export Log" button saves all the log data along with the current settings in a file. Conversely, the "Import Log" button imports log data and the Central Logger's current settings from a file. Use the Export and import when you want to persist log data for debugging or field support.
- The "Hide Left Panel" button hides the left panel so that only the log list is visible.
- The Process Monitor provides details about the Finsemble processes that are currently running. It's sort of like the Window's Task Manager, but for your Finsemble application.
- localhost:9090 brings up the Chromium console. This may not work on a mac.
See also
For in-depth info about the Central Logger, see the Logger Client documentation.
For step by step instructions on generating log data for support from ChartIQ, check out Troubleshooting.
To learn more about debugging Finsemble so you can iterate more efficiently, see Debugging Finsemble.