Troubleshooting Finsemble
It’s impossible to foresee all the issues you can run into when you deploy and run any software. Finsemble is no different. You can expect that occasionally you might run into an issue that you’ll have to troubleshoot. In this topic, we outline the investigative process, and then present the most common issues. If you follow the process and you still can’t resolve the issue, contact support@finsemble.com.
This topic focuses on techniques that help you zero in on a specific problem. If you need help with the iterative process of resolving code issues, check out Debugging Finsemble.
Start with the Central Logger
When something goes wrong, the first step is gathering information. But where to start? Each component and each window has its own log. If you have a lot of different components, examining each of these logs would be difficult. It gets even more complex if you’re not sure which component is giving you trouble.
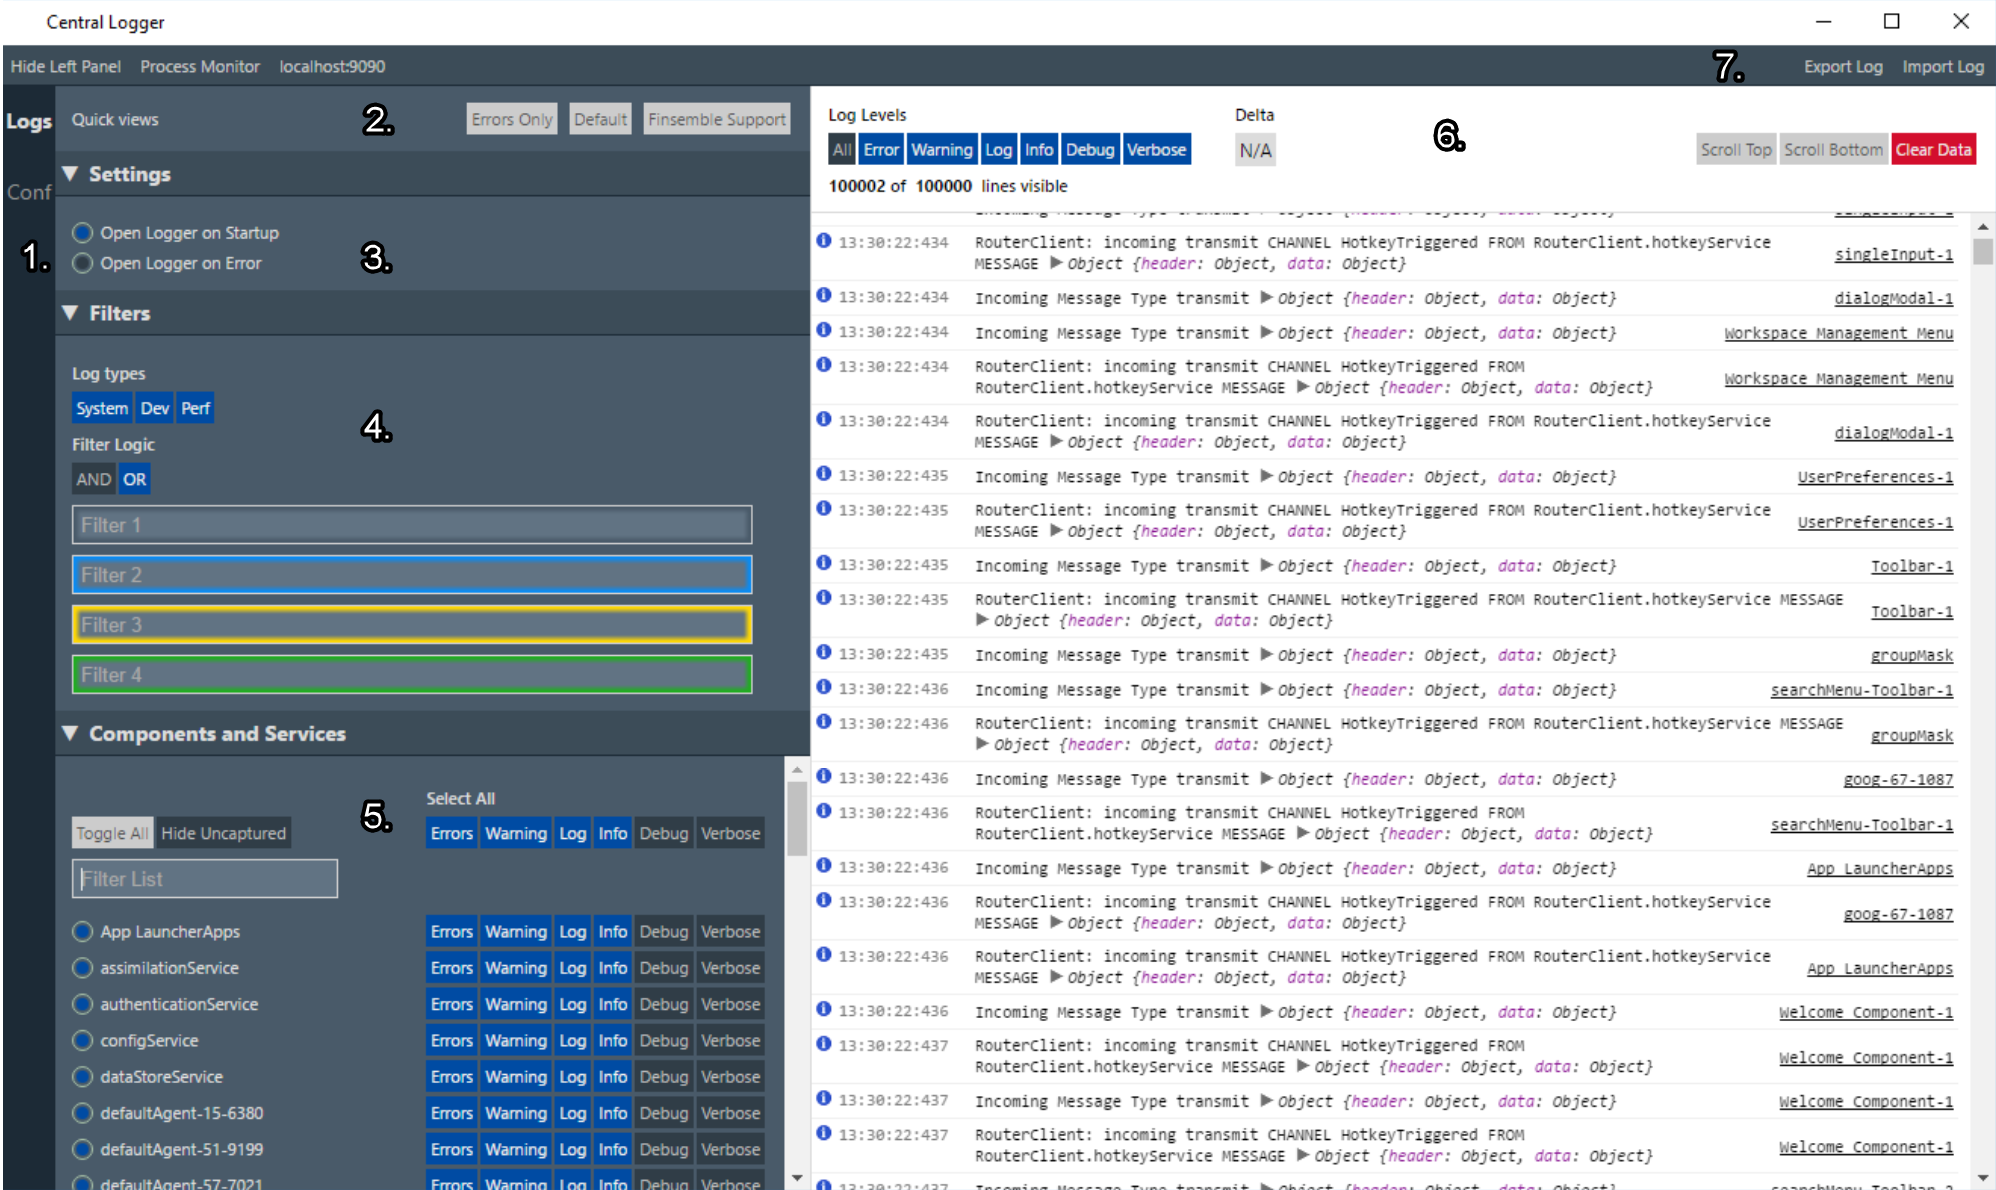
In Finsemble, the best place to start your investigation is the Central Logger. Here, we can see information collected from multiple sources in one place. The information includes logs from various components and services, all consolidated in one place so you don’t have to chase information throughout the system.
For a quick way to open the logger press Ctrl+Shift+L.
Setting the levels of detail
You are fully in control of how much detail is captured and how much detail is displayed. The log level settings persist between sessions, so that when you restart Finsemble you don’t have to reset anything. You can set log levels globally or at the component level. As you’re troubleshooting, experiment with the level that works best for you.
There is a fine line between not enough detail and having so many log entries that you can’t make sense of them all. The logger can flood you with messages if you set the capture log level too low and don’t apply any filters. One example is the router service, which logs all the messages that go through the router. It can happily log thousands of messages per minute. If you don’t need them, don’t capture them.
Finsemble can collect a lot of information, but there is a performance penalty for this level of detail. For this reason, we strongly recommend that you reset your log levels back to the default setting after you’re done troubleshooting. The easiest way to do this is to use the Reset button.
To keep the Central Logger's memory consumption low, there is a 10 kB size limit for logged messages. For any message that exceeds this limit, Finsemble trims down its properties so that the limit is not exceeded. Usually, this is not a problem, but if you want to log larger messages, you can do so by specifying 'forceObjectsToLogger' as the first argument like this:
Logger.console.log("forceObjectsToLogger", "Initial manifest", manifest);
Filtering
You can dynamically filter the log messages to make it easier to find what you need. Filtering doesn’t affect the data capture. So, you can see the smaller set of data without worrying about the irrelevant info, but that info is still being captured if you later decide you need it.
To filter, type the string you want to search for in one of the filter boxes. You can use up to 4 filters, and combine them with a logical AND or logical OR. In addition, you can also use a NOT operator, by adding a - symbol in front of the expression. The negative expression is always ANDed with the rest of the expressions even if you choose OR.
You can also use the log level filters at the top of the right-hand column to temporarily enable and disable the log messages of a particular level.
Exporting data from the Central Logger
The data that the logger collects resides in memory. This means that when you shut down Finsemble, all the logging information is lost. If you want to keep this information after your Finsemble session ends, you need to export it before you exit Finsemble. You can’t export it programmatically, so the only way is to use the Central Logger interface. (You can also persist logs, as we will see in the next section.)
Click “Export log” in the upper right corner of the logger window, and then save the log file to the appropriate location.
The exporting feature is useful when you’re troubleshooting a machine of a specific user locally. It can also be used by the Finsemble support team if you need help analyzing the data.
To view the exported log you must import it back into the Central Logger. Click “Import log”, navigate to the location where you saved the exported log, and then click Open. You can of course import logs that someone else has exported, possibly on another machine. The support team does this often when they want to see step by step what Finsemble is doing on the affected machine.
The exported .zip file can be large. If you need it to be smaller. Unzip it and zip it again to reduce the size.
For security reasons, you can't configure Finsemble persist logs to the file system. It is possible to send the log entries to an aggregator such as Splunk or Kibana. Use this recipe to configure this ability.
Storing and persisting logs
Logs are extremely valuable for debugging, but at the same time sometimes they can require a lot of memory resources. For this reason, the Central logger stores all logs in memory, and captures only the last 100,000 log messages, discarding the oldest records. For the same reason the logs you see in the Central Logger are only for the current session. The Central Logger doesn’t persist logs for previous sessions.
You might occasionally find that you do want to keep logs from previous sessions, or you might want to view logs from a specific user's session without first directly exporting a file via their machine. You can export session logs out and store them by creating an app service.
At its core, the logging export service listens for incoming log messages and sends them to an external logging service endpoint such as Elk or Splunk.
To make this app service work for you, you might need to make adjustments for formatting, batching, ordering, and filtering.
Listening for messages
To persist your logs, you need to listen for messages and send them to your logging end point. There are two sets of logs that you might want to listen for, Central Logger logs and Finsemble Electron Adapter logs. Use this code to listen to these logs:
const FSBLReady = () => {
  // Listen for Central Logger logs
  FSBL.Clients.RouterClient.addListener("logger.service.logMessages", (error, response) => {
    if (!error) {
      // Send to logs endpoint
      processLogs(response.data)
    }
  });


  // Listen for Finsemble Electron Adapter logs
  FSBL.System.addEventListener("log-fea", (feaMessages) => {
    // The FEA log format is different to the Central logger format
    const logMessages = normalizeFEALogs(feaMessages)
    // Send to logs endpoint
    processLogs(logMessages)
  })
}


if (window.FSBL && FSBL.addEventListener) {
  FSBL.addEventListener("onReady", FSBLReady);
} else {
  window.addEventListener("FSBLReady", FSBLReady);
}
Formatting
If the existing log format does not fit your needs, you can convert the logs when they come in, before sending them to your remote logging server. When you store the logs on your remote logging server, you might not be able to tell which logs belong to which session or machine. You can add a session identifier or machine identifier to help you find the correct logs when you need them.
Central Logger log format
Responses from the Router query arrive in this format:
const logMessages = [
  {
    //Log message type: system, dev or perf
    "category": "system",
    //The registered name of the logger instance
    "logClientName": "Finsemble",
    //Log level: Error, Warning, Log, Info, Debug, Verbose
    "logType": "Log",
    //JSON encoded array of message and data components of the log message
    // N.B. maybe be prefixed by string "*** Logging Error: ""
    "logData": "[\"SERVICE LIFECYCLE: STATE CHANGE: Service initializing\",\"windowService\"]",
    //Log message timestamp for ordering use
    "logTimestamp": 1544090028391.6226
  },
  {
    // There may be one or more message in the array
  }
]
Finsemble Electron Adapter log format
The Finsemble Electron Adapter log format is different from the Central Logger format. Normalize the FEA log format to match the Central Logger format before processing it.
const normalizeFEALogs = (feaMessages) => {
  // FEA Logs can be a single message or an array
  if(!Array.isArray(feaMessages)) {
    feaMessages = [feaMessages];
  }


  return feaMessages.map(message => {
    return {
      category: "system",
      logClientName: "finsembleElectronAdapter",
      logType: message.level,
      logData: message.logData,
      logTimestamp: message.time
    }
  })
}
Batching
Sending messages to the logging endpoint as soon as they come in can cause a lot of network traffic, which can slow down the network and the system. One solution to this is to send your messages to the logging endpoint in batches. Here is how:
const logBatch = [];
let timeout;
const TIMEOUT_MILLISECS = 30 * 1000;
const BATCH_SIZE = 100;

const processLogs = (logMessages) => {
  if (logMessages) {
    for (let i = 0; i < logMessages.length; i++) {
      // You may want to format or filter the messages here
      if(filterMessage(logMessages[i])) {
        logBatch.push(logMessages[i]);
      }
    }


    if (logBatch.length >= BATCH_SIZE) {
      transmitBatch();
    } else if (!timeout) {
      // Always transmit batch within timeout
      timeout = setTimeout(transmitBatch, TIMEOUT_MILLISECS);
    }
  }
}

const transmitBatch = () => {
  if(timeout) {
    clearTimeout(timeout)
  }

  const messagesToSend = logBatch.splice(0, logBatch.length)
  // You could sort messages here.
  //Note: Due to the async nature of logging, you might still send a later batch containing messages with an earlier logTimestamp.
  sendToEndPoint(messagesToSend)
}
Ordering
Depending on how your logging endpoint processes, stores, or retrieves incoming logs, you may need to put the log entries in chronological order before you send them to your logging endpoint.
Because the logging process is asynchronous, you might still send a later batch containing messages with an earlier logTimestamp. If possible, we recommend that you avoid sorting messages in this service if messages will be sorted elsewhere.
Filtering
You might want to send only selected logs to your remote logging server. If this is the case, you can filter out any messages you don't want before sending them. Here’s an example:
const filterMessage = (message) => {
  const includedTypes = ["Log","Error"]
  if(!includedTypes.includes(message.logType)) {
    return false;
  }

  const regexString = /excludedString/i;
  if(message.logData.match(regexString)) {
    return false;
  }

  return true;
}
Diagnosing configuration issues
Finsemble is config-driven. Many issues are caused by misconfigurations. For this reason you want to pay particular attention to configs. You might find an incorrect URL, a property that is not set correctly, or even a syntax error in the config file.
To see the fully processed Finsemble configuration in the Central Logger, click the Conf link on the left margin. Every application and service has an entry in this config JSON file. So if a window is not behaving in a way you expect, find it in the configuration and take a look at its settings. Is it the right windowType? Do you see anything else unusual about it?
Finding the part you’re looking for in the configuration might not be easy by just scrolling through. In some cases, you might have thousands of entries. Therefore, you can search this file by pressing Ctrl+F.
Diagnose config file issues
You need to define many different configurations, including what apps you want to add to a smart desktop, what intents they listen for and where to put them, and so on. All this information resides in config files. Most deployments have a large number of config files.
You might think it matters where these config files reside (and we do provide a default location for them at public/configs) but it doesn’t. You can host them anywhere you want. This is so because Finsemble downloads the config files by URL at runtime. If you run into issues with a config file not loading, check that it is at the expected URL and that you can load that URL in a browser.
If Finsemble doesn’t launch
The earliest you can open the Central Logger is on startup of the Logging service - which it can be set to do automatically. You can also configure it to open on error. This means that the Central Logger might not be available if Finsemble doesn’t fully start, even if you configured it to start on error and there are clearly errors. If this happens, all the logs might not be easily accessible in one place, but all is not lost. You can also check out the inspectable webContents webpage to gain some insight into the problem.
Saving Central Logger messages to disk
By default, Central Logger stores messages in memory. This means the messages don't persist. If you want to preserve some or all messages, you can forward them to disk by setting the logToDiskLevels config flag. When you set this flag, the specified types of log messages will be saved to the Finsemble Electron Adapter (FEA) log (see below for more information on this log.)
For example, here's how to save all errors and warnings to disk by setting logToDiskLevels in your manifest:
"finsemble" : {
    "logger" : {
        "logToDiskLevels" : ["error","warn"]
    }
}
We recommend that you use this setting only in development or when diagnosing problems in the field. Too high a setting could fill up a user's disk.
Inspectable web contents
To access the list of inspectable web contents pages, type http://localhost:9090 in the address bar of your browser. (You can also access this information from the Central Logger if it’s open by clicking localhost:9090 on the upper left.)
The page that appears lists all of the javascript windows (for both apps and services) that are currently running. This means that Finsemble tried to start, and is partially up, as some windows are running and others are not.
Native components aren’t listed on this page.
It is possible that the Central Logger started but the Finsemble UI didn’t. In that case, you can still launch the Central Logger:
- Find Central Logger in the list of running components.
- Open the browser console by clicking Central Logger
- In the window that opens, navigate to the console by clicking >>, and then type
showConsole().
Shutting down and restarting programmatically
In addition to shutting down and restarting Finsemble manually, you can also do so programmatically. Here are the commands:
| Command | Action | Clean |
|---|---|---|
FSBL.shutdownApplication() | Shutdown | Yes |
FSBL.System.exit() (deprecated) | Shutdown | No |
FSBL.restartApplication() | Restart | Yes |
FSBL.restartApplication({forceRestart: true}) | Restart | No |
Some commands don't perform their action gracefully. They don't present the prompt about saving the workspace.
Investigate startup problems with the System Manager / system log
If you find that Finsemble doesn’t start up properly, and especially if there is a problem with services, begin your investigation with the System Manager window. Finsemble automatically displays this window when it encounters boot errors, such as a service that fails to start.
Many problems occur because the boot sequence isn’t quite what you expected. To learn about the sequence and to find errors in it, use System Manager. This is a great place to investigate startup issues because any errors will usually be displayed on this console.
Start by looking at the boot sequence. Find the boot stages and examine what’s happening at each stage. There will be services that get initialized at each stage.
Frequently diagnosed startup issues
Here are the most common startup issues:
- Failed importing into finsemble config because of bad URL or illegal JSON. Often, this is the result of a typo or a wrong URL. Check your config files for a syntax error. If that's not it, make sure all the URLs specified in your manifest or public/configs/application/config.json file are correct and accessible.
- Error in stage [stage]: [stage] illegal boot configuration "0: initializeDeepLinkingTask dependency "[a dependency]" is unknown in this stage or previous stages. The startup manager couldn't find the dependency you specified. The first step is to verify that this dependency actually exists. Make sure to also check the spelling, as a typo here is one of the most common causes of this problem. If the dependency exists and is spelled correctly, the boot stage for your dependency is too late.
- Error in stage "[stage]": [stage] circular dependency. A circular dependency occurs when service1 depends on service2, and service2 depends on service1. The error message highlights the exact services in the cycle. Remove the circular dependency.
- [service] startup failed due to a time out. The service was started, but hasn’t come fully online before it timed out. This may be due to a poor network connection or issue with the hosting of your Finsemble desktop. If so, increasing the default service startup timeout may resolve your issue. Otherwise, this may be a symptom of another problem, which you need to investigate further. Check the service for errors in the Central Logger. If there are no errors in Central Logger and you are developing locally, go to http://localhost:9090 and click the service name to open the DevTools.
Investigate Finsemble Electron Adapter (FEA)
If the steps we have just looked at haven’t resolved your problem, you need to dig deeper. The next step is to investigate the Finsemble Electron Adapter (FEA).
Finsemble runs on Electron, but Electron isn’t set up by default for security. For this reason, FEA is designed to secure your desktop by default, and implements all the security recommendations from the Electron team. The most important of these recommendations are that Chromium sandboxing should be turned on and node integration should be off. In addition, following the security principle of isolation, FEA removes the Electron API from all the windows to ensure isolation between one window and another, and also between each window and the operating system. To manage secure communications between windows and the operating system, Finsemble provides the router and other services.
Unlike Central Logger, FEA writes logs to the file system so that they persist after you shut down Finsemble and can help diagnose startup issues. Here are the log locations:
- Windows: %AppData%\Roaming\Electron\logs
- MacOS: ~/Library/Application\ Support/Electron/logs/
Only the FEA log data persists because it’s written to the file system. If you want to save the data from Central Logger, you must export it.
Review and verify code
Next, take a closer look at your code. The first thing is to verify that the types are specified correctly. Even good developers can make a mistake here.
Another problem you might encounter is race conditions. In any software, these can be difficult and frustrating to diagnose because they can often be intermittent. Sometimes things time out, at other times everything works fine.
In .NET code, companies often use newtonsoft.json. It provides classes that you can use for implementing important services, but it is a third party product, and therefore it isn’t always upgraded. In fact, some companies disallow version 7 as a security policy. . Finsemble requires version 7 or later. Unless you upgrade, we don’t have a good way around it.
Troubleshooting app issues
In Finsemble, a typical app has a window that consists of two parts, each of which has its own Electron process. The app's window contains the WindowTitleBar while the app itself is in an Electron BrowserView that is contained within the window. For windowless apps, apps that use affinity, and apps spawned by window.open() there is only one window.
When you press Ctrl+Shift+i, the developer tools for the app content are always displayed regardless of whether the window has one part or two parts.
In the Central Logger, two links are provided for apps that use BrowserViews. The WindowTitleBar window displays "(Titlebar)". Click on either of that link to get the developer tools for the WindowTitleBar.
You can disable or override Ctrl+Shift+i key combination that opens the developer tools. More information on Hotkeys.
Diagnosing FDC3 2.0 raiseIntent issues
FDC3 2.0 provides much more power than the earlier versions of the Standard by allowing raiseIntent to return a result. However, this new power can also result in more diagnostic complexity.
To support raiseIntent diagnostics, Finsemble has tagged key log messages to show the path of execution and data when raising an intent. To use the Central Logger to see these tagged messages, specify tag:FDC3 as the log filter as shown here:
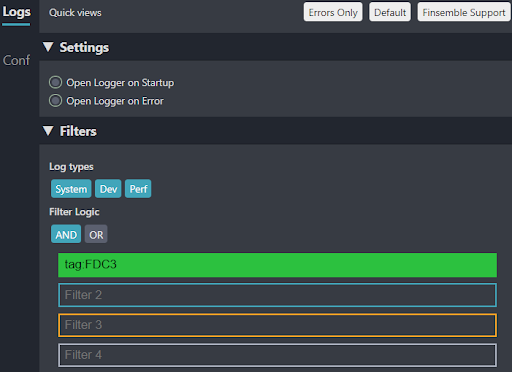
This tag:FDC3 example shows the flow for raiseIntent with messages interchanged between four entities:
- The Originating app (AG-Grid),
- The InteropService (FDC3’s DA),
- The target App (ChartIQ Example)
- The FDC3 Resolver
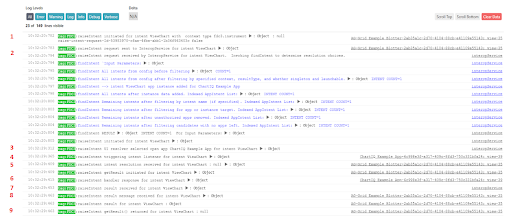
Specifically, here is what's happening in our example:
- The originating app, AG-Grid, raises an intent and sends the
raiseIntentrequest to Finsemble’s Interop Service. - The Interop Service receives the
raiseIntentrequest.raiseIntentuses the underlyingfindIntentfunction. What you see next depends on your Central logger debug setting. If you have enabled this setting, you will see thefindIntentparameters from the intent request, as shown in our figure. Otherwise, you will only see the final result offindIntent. Here is the full list of parameters:- the
findIntentparameters from the intent request - all intent definitions known to config. This includes all the Finsemble AppD configurations under finsemble.apps
- an updated list of intents after filtering based on the input parameters
- specific instance data from each open app that is added to intent data
- an updated list of intents after all instance data has been added
- an updated list after filtering intents by name (if a name is specified)
- an updated list after filtering by a target parameter (the target may be an
appIdor a specificinstanceId) - an updated list after removing any unauthorized apps (based on selectConnect authorization)
- an updated list after removing any intents that no longer have any related apps
- the final findIntent result
- the
raiseIntentto be initiated using the original input and the results offindIntent.
- the
- Because intent resolution is necessary, the results from Finsemble’s FDC3 Resolver app appear, with the target app, ChartIQ Example Chart, selected. In some cases it is impossible to determine the target automatically, and the user needs to provide the answer to the resolver to choose the correct app to open.
- An instance of the ChartIQ Example Chart app opens and receives the intent.
- The originating app, AG-Grid, receives the intent resolution and initiates a call to
getResult. - The target app, ChartIQ Example Chart, returns an intent response.
- The Interop Service receives the intent response and routes it to the originator, in this case the instance of AG-Grid.
- The originator, AG-Grid, receives the intent response sent from ChartIQ Example Chart, processes and verifies the intent result.
- The originating app, AG-Grid, receives the result from
getResult().
This log flow is representative for raiseIntent when resolution is needed. The raiseIntent flow will vary based on the configuration and raiseIntent arguments.
Troubleshooting services
Services have been deprecated and replaced with "app services". You can debug app services like any app.
For the most part, you can think of a service as an invisible window. The biggest difference is that a service component doesn’t have a FSBL object injected into it.
When you implement a service, you must extend the Finsemble base service and configure Finsemble to start your service.
We said earlier that service windows are invisible. In production this is exactly what you want, but while troubleshooting it would be nice to make such windows temporarily visible. You can configure a service window to make it visible by setting the visible property to true. The window won’t display much info, and will be basically black, unless you add a UI to it, but you can press Ctrl+Shift+I to launch the dev tools for the service.
It is also sometimes helpful to delay the startup of the service. You can achieve this by setting the debugServiceDelay to the time delay that you want, in milliseconds:
{
    ...
    "visible": true,
    "showDevConsoleOnVisible": true,
    "debugServiceDelay": 60000,
    ...
}
In our example, we delay the startup of the service for one minute. You can use this time to visit the console and set up some breakpoints that you can use to observe the behavior of the service.
The delay you configure this way overrides the service timeout. So don’t worry about your service timing out while you’re examining the breakpoints. If the delay period isn’t enough, you can always make it longer.
The service window itself might be invisible, but there is no such thing as an invisible service. Every service you create and every service that Finsemble provides can be found in the Central Logger. When you click it, you launch the DevTools for that specific service, where you can also access the source code for that service in the Source tab.
Services often communicate with components and with each other by using the router. For more info, see The Router.
Interop Service: Redux devtools
Finsemble's Interop Service is based on Redux. Redux's devtools are automatically enabled for debugging. To display the devtools, add this config entry to public/configs/application/config.json and then restart Finsemble.
"servicesConfig" : {
  "interop" : {
     "visible": true
  }
}
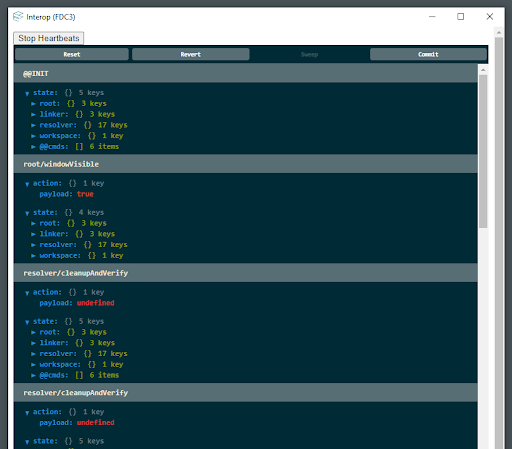
When the interop devtools appear, you can begin debugging. You can check if your app is connected to the Interop Service by watching for a resolver/register redux action. The main FDC3 interactions result in resolver/broadcast, resolver/raiseIntent, resolver/subscribeContext or resolver/subscribeIntent actions. You can peek inside any action to verify that the data looks accurate.
In the redux store, the root/testing section shows the results of the Interop Service's internal algorithms. Here you can see the destinations for broadcast messages as well as the selectConnect rules that were triggered.
If you need help with interop issues, contact us at support@finsemble.com.
Clearing the Chromium cache
When you clear the Chromium cache you clear all the cached data containing window state/positions, application resource files (images, HTML, JavaScript files), cookies, and items stored in the Local Storage.
Note that there is an overlap with the IndexedDB and LocalStorage adapters which are part of the Chromium cache.
Use this code to clear the Chromium Cache, adjusting properties to meet your needs:
FSBL.System.clearCache({
appcache: true,
cookies: false,
localStorage: false,
shadercache: true,
websql: true,
serviceworkers: true,
cachestorage: true
})
In general, it's best for an app to not clear the cache unless you have a specific reason to. You can prevent an application or component from clearing the Chromium cache by either marking the component security policy as untrusted or by creating a custom security policy to provide a more granular access to sensitive APIs. See Security policies for more detail.
We recommend that you always restart Finsemble after clearing the Chromium cache. This way you can be sure that Finsemble re-retrieves all the preferences, workspaces, and so on.
In addition to the Chromium cache, Finsemble also uses a storage client cache. To clear this cache, see Clearing the storage client cache.
Common issues
A window opens, but is blank
Open the Chromium developer tools for the window.
If it shows a URL and error in the window, confirm that the URL exists by loading it in your browser and that the file exists at the expected location. If it is not there, then confirm that you have configured the build correctly for that component and that your configuration includes the correct URL.
When I try to access API clients via the FSBL object, it appears that they are not loaded even though Finsemble is running
A race condition can occur when code that is trying to access Finsemble API clients gets loaded before the API itself is fully loaded. This can sometimes happen in a preload. To avoid this problem, we use the following pattern. This example assumes a React component, but the pattern applies to any javascript framework or application used in Finsemble:
const FSBLReady = () => {
    ReactDOM.render(
        <ExampleOutput />,
        document.getElementById("example-output-div")
    );
};
if (window.FSBL && FSBL.addEventListener) {
    FSBL.addEventListener("onReady", FSBLReady);
} else {
    window.addEventListener("FSBLReady", FSBLReady);
}
The windows of my components don’t align
When you group windows together, under certain conditions they might not align correctly and have very small gaps, or one is slightly larger than the others.
This behavior is usually due to the Windows Display Settings using a scaling multiplier that is not an even increment of 100%. Uneven scaling multipliers can result in rounding errors for window sizes. Ideally, you should set your display scaling setting to 100% or multiples of it, for example, 200%.
My code is slow to build or behaves oddly, like the processor is overloaded
If you experience slow builds, check that the Windows battery settings are set to allow max performance if you are on a laptop. You can confirm this by clicking the battery icon in your task tray and dragging the slider in the pop-up window all the way to 100% for best performance. The default Windows performance setting when using battery power is 50% and can be customized, with settings being preserved between reboots. This can dramatically scale back CPU performance, causing the issues you are observing.
Hosting your project and build folder on a network disk can also adversely affect performance. For best performance, use a folder hosted on a local hard disk.
Ineffective mark-compacts near heap limit Allocation failed - JavaScript heap out of memory error when building the seed project
This error indicates that webpack needs more memory than is allocated to Node.js. Node's default maximum memory size is 2GB but webpack can sometimes exceed this during multi entry builds (such as when building a large number of components in the seed).
The seed project's webpack/buildHelpers.js file includes the line env.NODE_OPTIONS="--max-old-space-size=4096" which raises Node's default memory limit to 4GB. If you are encountering an "out of memory" error then you may have an older version of this file that is missing this line, or you may need to adjust this value higher than 4GB. You can choose any value (it does not need to be an even increment) and there is no serious penalty to setting too high a limit because Node will only claim the memory it needs and will release memory that it doesn't use.
I find the syntax error: invalid token
If you see this error, then either a JavaScript preload or script tag might be missing (server 404 error) or it is being served without the correct character set. If this error occurs in an html page, try including <meta charset="utf-8"> in the HEAD tag of your HTML.
When I run npm install I get many errors and messages about locks or permissions
Some versions of npm have a bug that allows for a race condition to occur when installing dependencies. When multiple packages are downloaded and installed at the same time, they could try to write to the same file or location, which throws these errors. We recommend that you either upgrade to a later npm version or use yarn instead.
My coworker and I run the same code but it looks different
This can be due to caching issues in the build. Sometimes the build caches don’t clear properly for a variety of reasons. As a result, you think both machines run the same code but they actually don’t.
To resolve this issue, shut down Finsemble, run yarn clean, and then rebuild Finsemble.
If these steps don’t resolve the issue, delete the Electron cache that your running Finsemble uses.
- Deleting the cache removes settings saved locally, potentially including saved Workspaces, Preferences and other local settings
- Don’t try to delete the cache when Finsemble is running.
To delete the cache:
- Open Windows Explorer and type
“%appdata%”into the path. Unless you have changed your settings, this will likely bring you to C:\Users{USERNAME}\AppData\Roaming. - In that folder, delete the “Electron” folder.
- Run
yarn startagain and see if that resolves the issue.
My .NET component has weird glyphs in the title bar instead of the symbols for close/maximize/etc
This can happen when you’re using third-party plugins and theming libraries, particularly DevExpress.
To prevent a DevExpress theme from being applied to the title bar, set the property dxc:ThemeManager.ThemeName="None" in the application’s xaml file, e.g.:
<Finsemble:WPFWindowTitleBar x:Name="FinsembleHeader" Height="25" VerticalAlignment="Top" Margin="0" Loaded="FinsembleHeader_Loaded" dxc:ThemeManager.ThemeName="None" />
Assimilation doesn’t extract assets correctly
Occasionally, Assimilation doesn't extract assets correctly. For example, some of the DLLs could be missing, or only the folder is created. When this happens Finsemble can’t start correctly because without the necessary files Assimilation can't start. But Finsemble sees that the folder exists, and assumes everything is fine and the asset has downloaded correctly. Finsemble doesn't try to download the asset again because it doesn’t know there is a problem. But this is in fact a serious problem: Finsemble can get into a bad state when Assimilation doesn't work due to missing DLLs. So fixing this problem is important.
In the past, the only way to get Finsemble to re-download the asset was to manually delete the assimilation folder from the assets folder. In Finsemble 6.6 we introduce a new function, FSBL.System.deleteAssets() which you can use to delete the app assets, including the folder they are in. You can then re-download the missing files.
Determine whether a component is launched or closed, and when
Sometimes it is helpful to know the details of the component opening or closing. Unfortunately this isn’t information that the Central Logger collects.
Currently we don’t have an event that fires when a specific component is launched. But you can retrieve a list of currently open windows with FSBL.Clients.LauncherClient.getActiveDescriptors. If you do it this way, you have to poll this API to know when components have been launched or closed.
Another possibility is to use WorkspaceEvents. which provides workspace state information instead of info about individual components. You can use this to get the workspace state, its components and use the getActiveDescriptors to find out whether a given workspace component has loaded.
Another option is to create a preload that transmits a router message when a window is launched or closed. To do so, you add a window event listener by using the finsembleWindow.addEventListener. Note that this API is experimental, which means that it might change in the future.
The list of the relevant window event names for components being closed are:
closedclose-requestedclose-completecomponent-state-changed(for evergreen components)
If you can't resolve your issue
If you tried our suggestions and you still can’t resolve your issue, it’s time to contact the Finsemble support team. To help us help you, gather as much information as you can. Follow these steps:
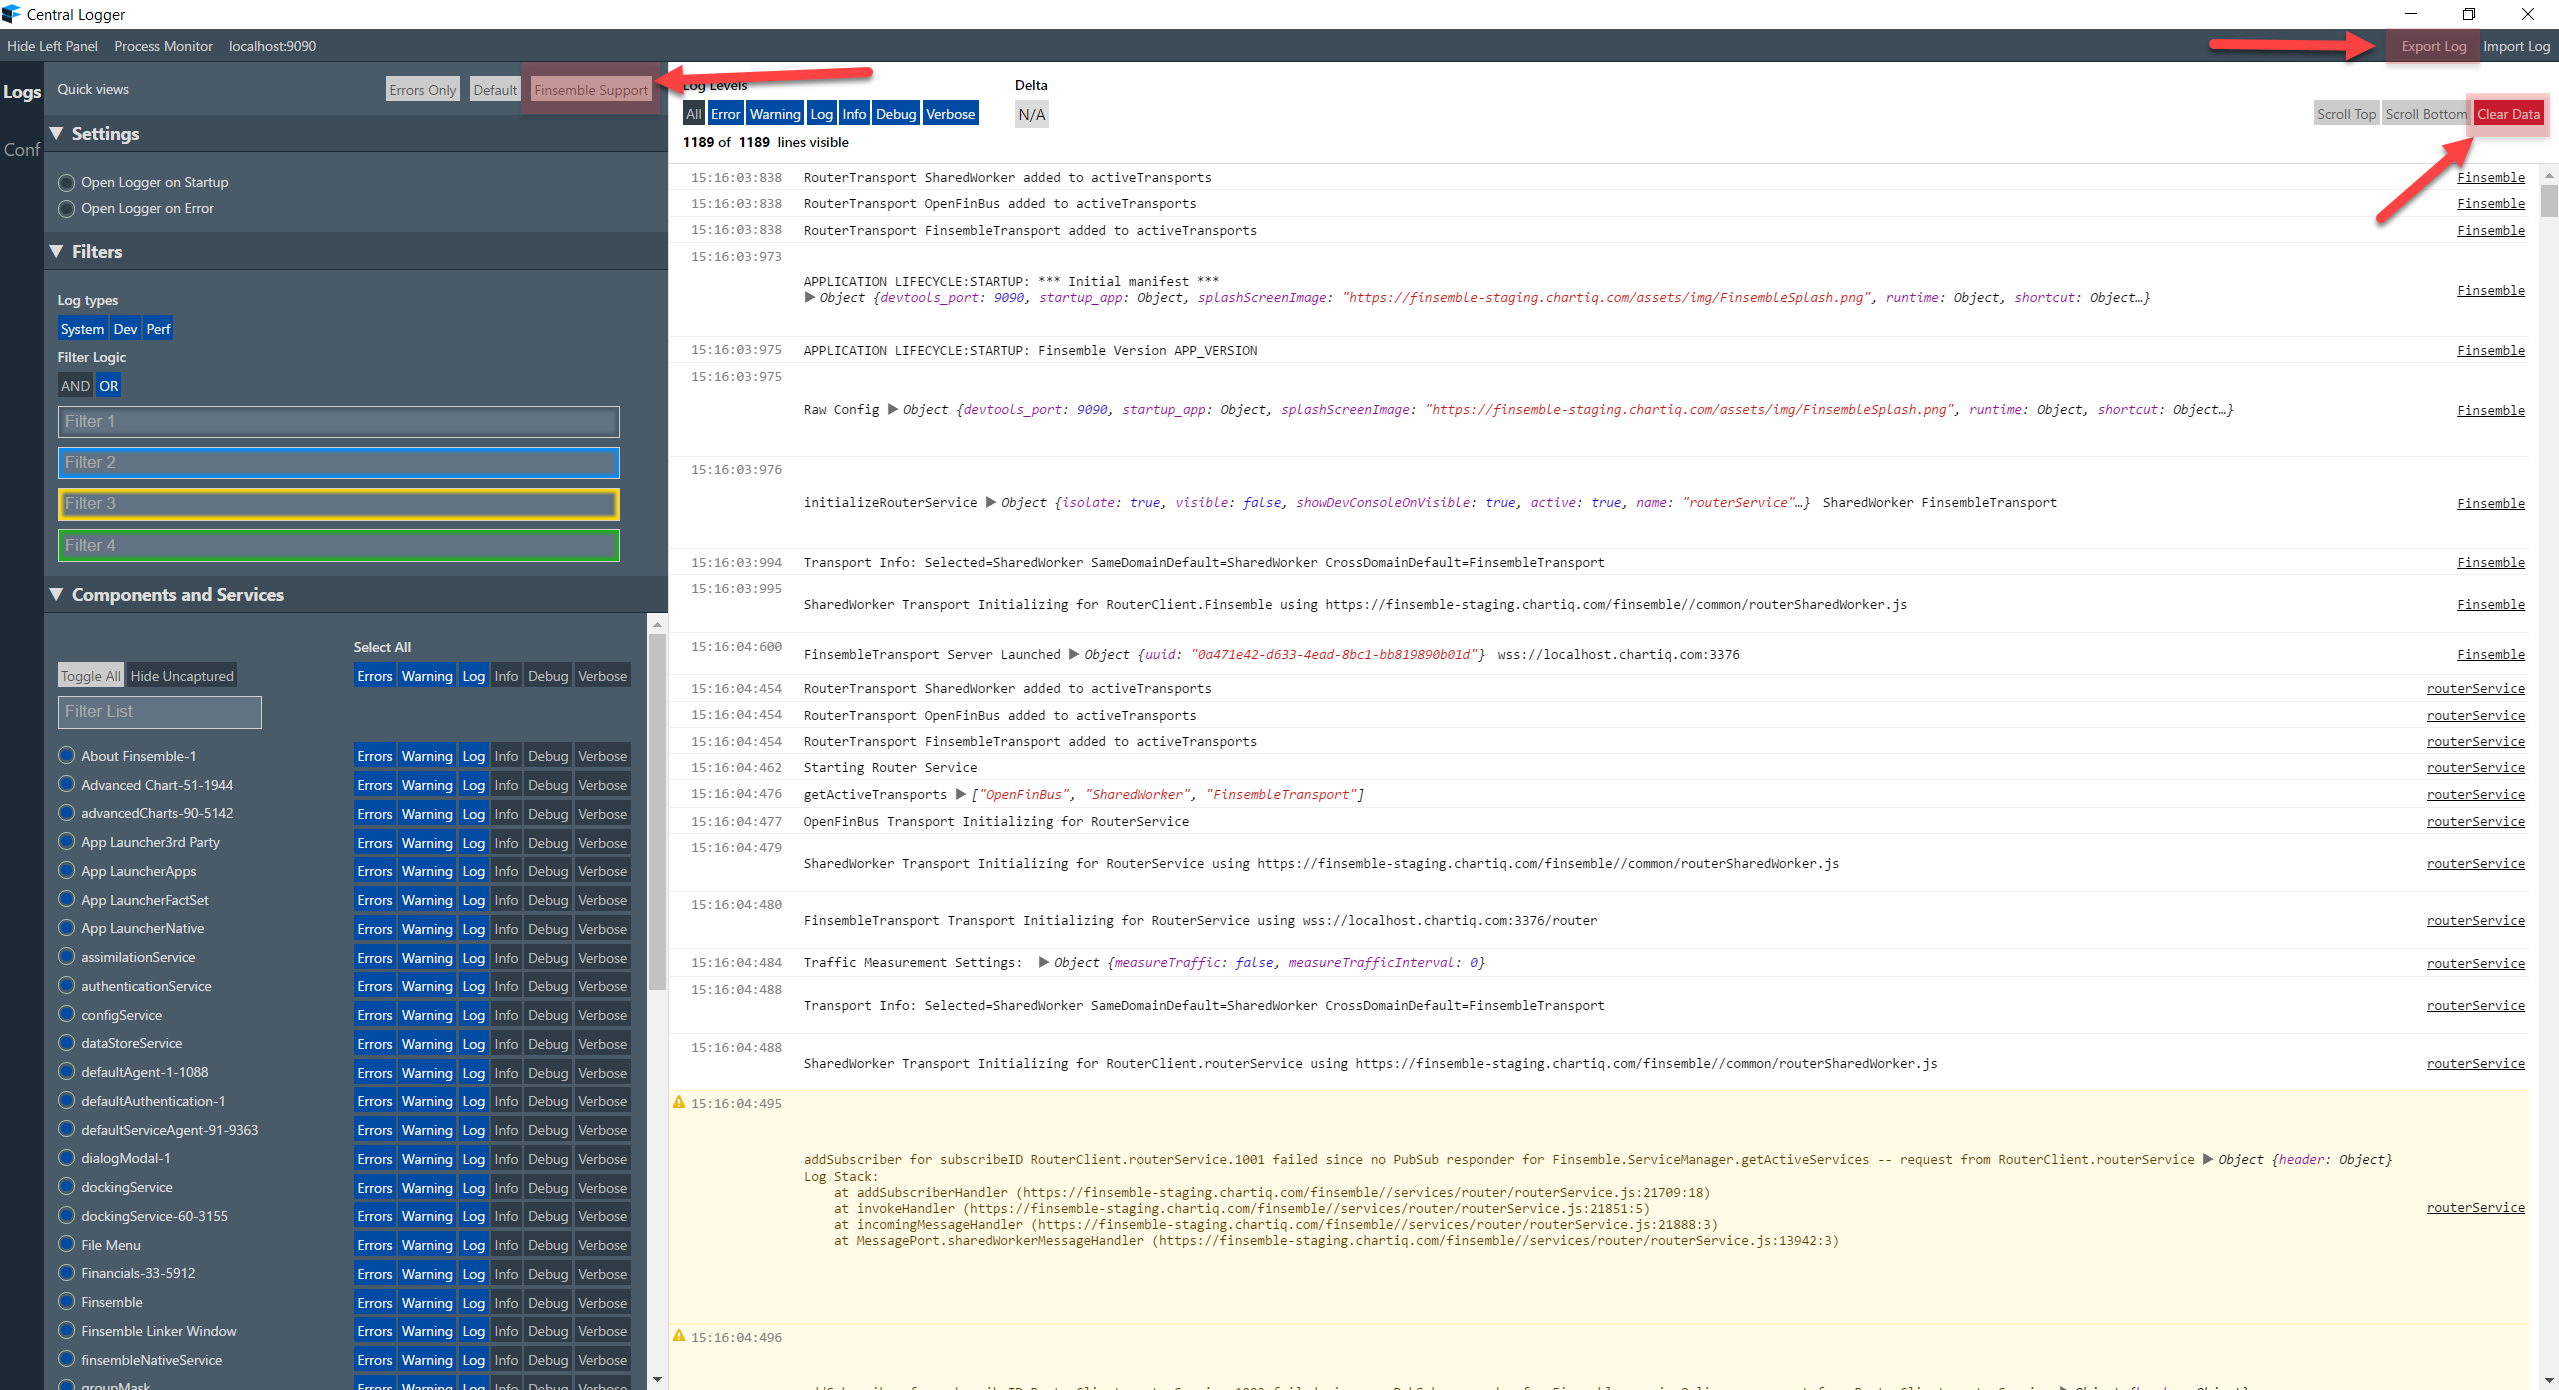
Launch the Central Logger.
Click the "Finsemble Support" button. This toggles the settings to capture a broad range of log levels.
Click "Clear Data" to start fresh.
Try to recreate the problem that you were experiencing. If gathering logs for a start-up problem, restart Finsemble to see if the error occurs.
If the problem occurred, save the log by clicking "Export Log."
Most log files are large. Zip the log files to compress them before sending them to Cosaic.
Email the log file to support@finsemble.com. Please include a detailed description of the problem you're experiencing in your email so that we can properly diagnose the problem.
This detailed logging level might introduce performance issues to your Finsemble application. After you're done debugging, it's best reduce the logging levels to their default state. To reset the log settings back to their original values, click the "Default" button under Quick Views.