 Legacy version 6 documentation. View current documentation.Legacy version 6 documentation. View current documentation.
It’s impossible to foresee all the issues you can run into when you deploy and run any software. Finsemble is no different. You can expect that occasionally you might run into an issue that you’ll have to troubleshoot. In this topic, we outline the investigative process, and then present the most common issues. If you follow the process and you still can’t resolve the issue, contact support@finsemble.com.
Note: This topic focuses on techniques that help you zero in on a specific problem. If you need help with the iterative process of resolving code issues, check out Debugging Finsemble.
When something goes wrong, the first step is gathering information. But where to start? Each component and each window has its own log. If you have a lot of different components, examining each of these logs would be difficult. It gets even more complex if you’re not sure which component is giving you trouble.
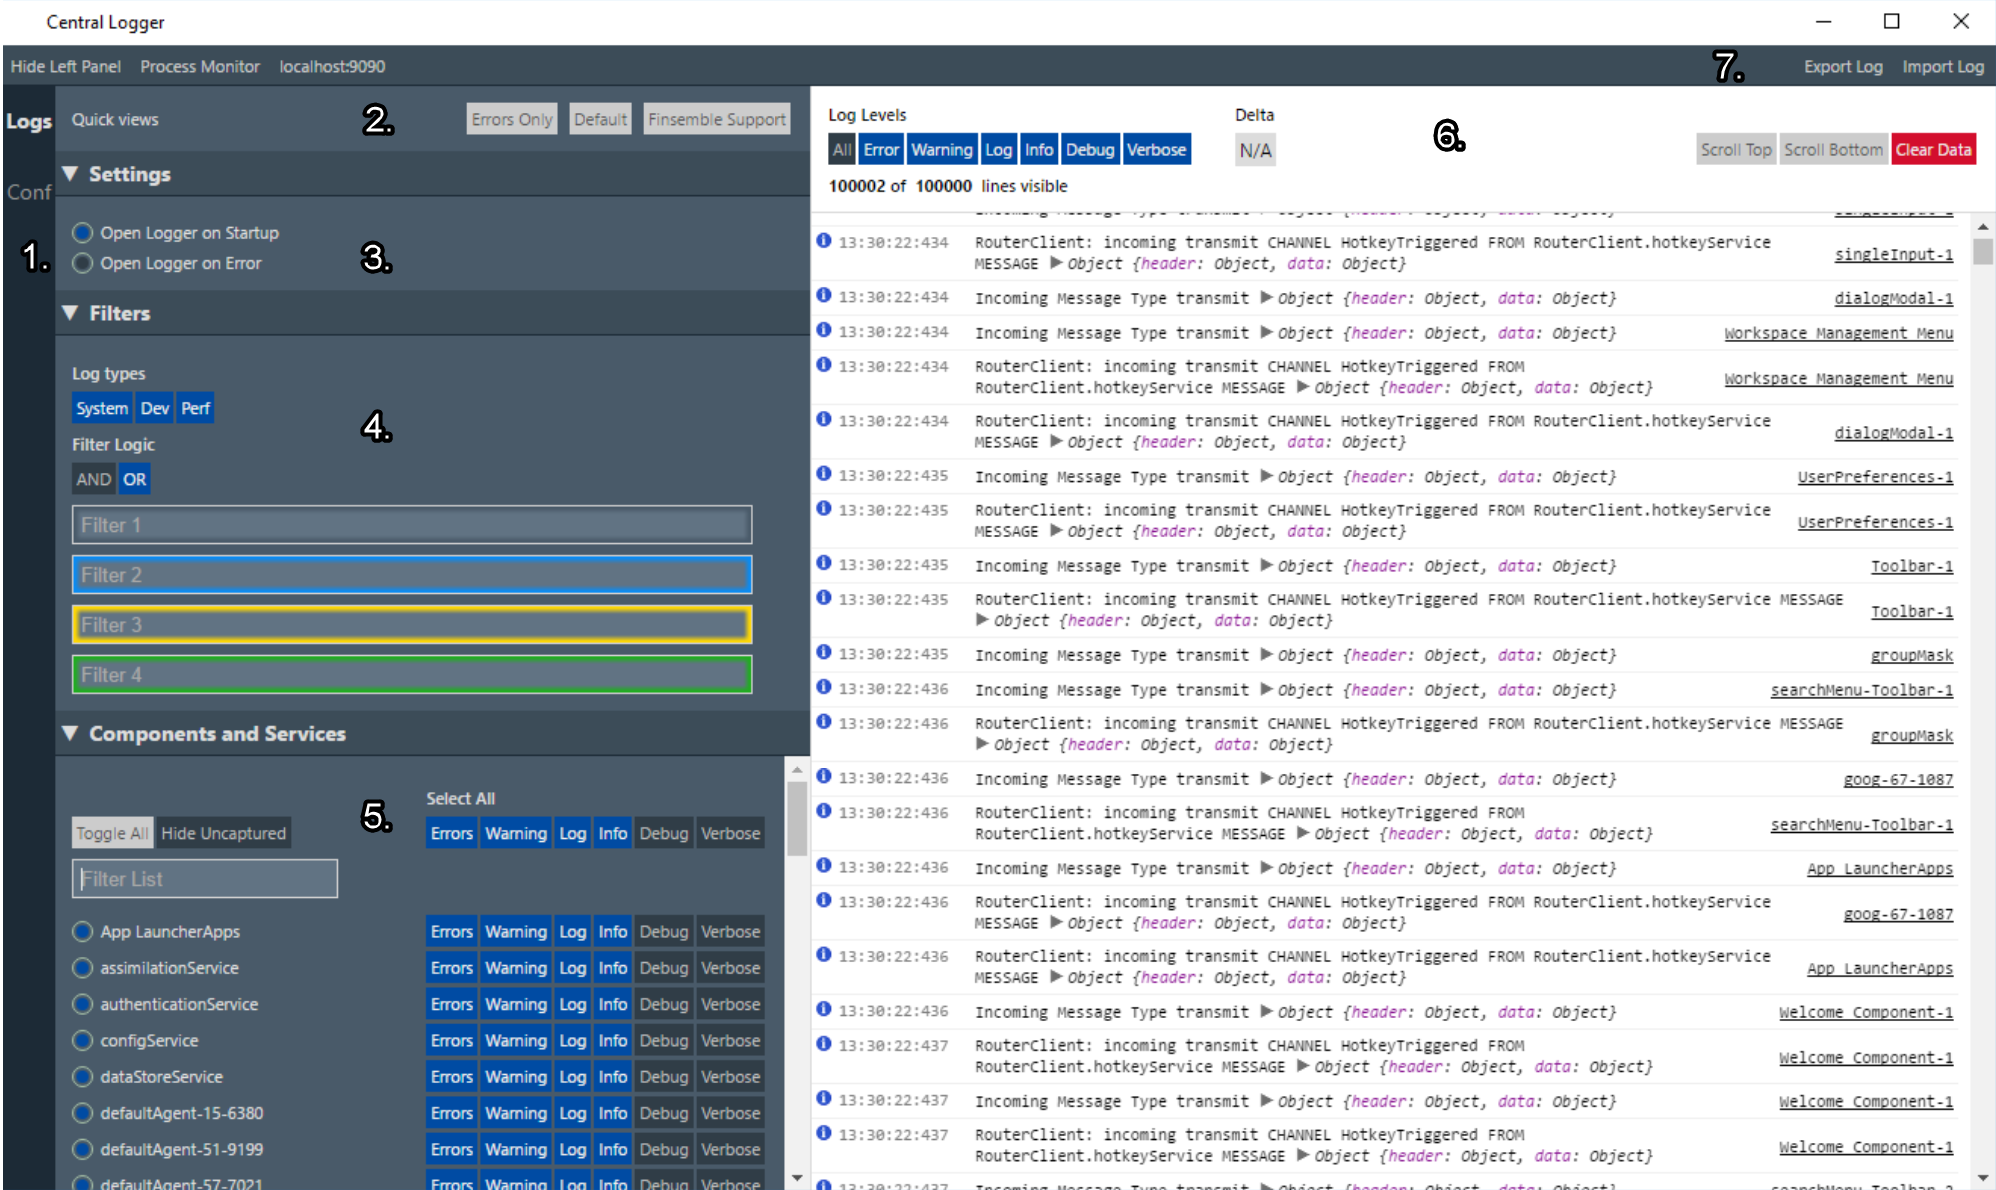
In Finsemble, the best place to start your investigation is the Central Logger. Here, we can see information collected from multiple sources in one place. The information includes logs from various components and services, all consolidated in one place so you don’t have to chase information throughout the system.
![]() Tip: For a quick way to open the logger press Ctrl+Shift+L.
Tip: For a quick way to open the logger press Ctrl+Shift+L.
You are fully in control of how much detail is captured and how much detail is displayed. The log level settings persist between sessions, so that when you restart Finsemble you don’t have to reset anything. You can set log levels globally or at the component level. As you’re troubleshooting, experiment with the level that works best for you.
There is a fine line between not enough detail and having so many log entries that you can’t make sense of them all. The logger can flood you with messages if you set the capture log level too low and don’t apply any filters. One example is the router service, which logs all the messages that go through the router. It can happily log thousands of messages per minute. If you don’t need them, don’t capture them.
![]() Caution: Finsemble can collect a lot of information, but there is a performance penalty for this level of detail. For this reason, we strongly recommend that you reset your log levels back to the default setting after you’re done troubleshooting. The easiest way to do this is to use the Reset button.
Caution: Finsemble can collect a lot of information, but there is a performance penalty for this level of detail. For this reason, we strongly recommend that you reset your log levels back to the default setting after you’re done troubleshooting. The easiest way to do this is to use the Reset button.
![]() Note: To keep the Central Logger's memory consumption low, there is a 10 kB size limit for logged messages. For any message that exceeds this limit, Finsemble trimms down its properties so that the limit is not exceeded. Usually, this is not a problem, but if you want to log larger messages, you can do so by specifying 'forceObjectsToLogger' as the first argument like this:
Note: To keep the Central Logger's memory consumption low, there is a 10 kB size limit for logged messages. For any message that exceeds this limit, Finsemble trimms down its properties so that the limit is not exceeded. Usually, this is not a problem, but if you want to log larger messages, you can do so by specifying 'forceObjectsToLogger' as the first argument like this:
Logger.console.log("forceObjectsToLogger", "Initial manifest", manifest);
You can dynamically filter the log messages to make it easier to find what you need. Filtering doesn’t affect the data capture. So, you can see the smaller set of data without worrying about the irrelevant info, but that info is still being captured if you later decide you need it.
To filter, type the string you want to search for in one of the filter boxes. You can use up to 4 filters, and combine them with a logical AND or logical OR. In addition, you can also use a NOT operator, by adding a - symbol in front of the expression. The negative expression is always ANDed with the rest of the expressions even if you choose OR.
You can also use the log level filters at the top of the right-hand column to temporarily enable and disable the log messages of a particular level.
The data that the logger collects resides in memory. This means that when you shut down Finsemble, all the logging information is lost. If you want to keep this information after your Finsemble session ends, you need to export it before you exit Finsemble. You can’t export it programmatically, so the only way is to use the Central Logger interface.
Click “Export log” in the upper right corner of the logger window, and then save the log file to the appropriate location.
The exporting feature is useful when you’re troubleshooting a machine of a specific user locally. It can also be used by the Finsemble support team if you need help analyzing the data. To view the exported log you must import it back into the Central Logger. Click “Import log”, navigate to the location where you saved the exported log, and then click Open. You can of course import logs that someone else has exported, possibly on another machine. The support team does this often when they want to see step by step what Finsemble is doing on the affected machine.
![]() Tip: The exported .zip file can be large. If you need it to be smaller. Unzip it and zip it again to reduce the size.
Tip: The exported .zip file can be large. If you need it to be smaller. Unzip it and zip it again to reduce the size.
![]() Note: For security reasons, you can't configure Finsemble persist logs to the file system. It is possible to send the log entries to an aggregator such as Splunk or Kibana. Use this recipe to configure this ability.
Note: For security reasons, you can't configure Finsemble persist logs to the file system. It is possible to send the log entries to an aggregator such as Splunk or Kibana. Use this recipe to configure this ability.
Finsemble is config-driven. Many issues are caused by misconfigurations. For this reason you want to pay particular attention to configs. You might find an incorrect URL, a property that is not set correctly, or even a syntax error in the config file.
To see the fully processed Finsemble configuration in the Central Logger, click the Conf link on the left margin. Every application and service has an entry in this config JSON file. So if a window is not behaving in a way you expect, find it in the configuration and take a look at its settings. Is it the right windowType? Do you see anything else unusual about it?
Finding the part you’re looking for in the configuration might not be easy by just scrolling through. In some cases, you might have thousands of entries. Therefore, you can search this file by pressing Ctrl+F.
You need to define many different configurations, including what apps you want to add to a smart desktop, what intents they listen for and where to put them, and so on. All this information resides in config files. Most deployments have a large number of config files.
You might think it matters where these config files reside (and we do provide a default location for them at public/configs) but it doesn’t. You can host them anywhere you want. This is so because Finsemble downloads the config files by URL at runtime. If you run into issues with a config file not loading, check that it is at the expected URL and that you can load that URL in a browser.
The earliest you can open the Central Logger is on startup of the Logging service - which it can be set to do automatically. You can also configure it to open on error. This means that the Central Logger might not be available if Finsemble doesn’t fully start, even if you configured it to start on error and there are clearly errors. If this happens, all the logs might not be easily accessible in one place, but all is not lost. You can also check out the inspectable webContents webpage to gain some insight into the problem.
To access the list of inspectable web contents pages, type http://localhost:9090 in the address bar of your browser. (You can also access this information from the Central Logger if it’s open by clicking localhost:9090 on the upper left.)
The page that appears lists all of the javascript windows (for both apps and services) that are currently running. This means that Finsemble tried to start, and is partially up, as some windows are running and others are not.
![]() Note: Native components aren’t listed on this page.
Note: Native components aren’t listed on this page.
It is possible that the Central Logger started but the Finsemble UI didn’t. In that case, you can still launch the Central Logger:
showConsole().If you find that Finsemble doesn’t start up properly, and especially if there is a problem with services, begin your investigation with the System Manager window. Finsemble automatically displays this window when it encounters boot errors, such as a service that fails to start.
Many problems occur because the boot sequence isn’t quite what you expected. To learn about the sequence and to find errors in it, use System Manager. This is a great place to investigate startup issues because any errors will usually be displayed on this console.
Start by looking at the boot sequence. Find the boot stages and examine what’s happening at each stage. There will be services that get initialized at each stage.
Here are the most common startup issues:
If the steps we have just looked at haven’t resolved your problem, you need to dig deeper. The next step is to investigate the Finsemble Electron Adapter (FEA).
Finsemble runs on Electron, but Electron isn’t set up by default for security. For this reason, FEA is designed to secure your desktop by default, and implements all the security recommendations from the Electron team. The most important of these recommendations are that Chromium sandboxing should be turned on and node integration should be off. In addition, following the security principle of isolation, FEA removes the Electron API from all the windows to ensure isolation between one window and another, and also between each window and the operating system. To manage secure communications between windows and the operating system, Finsemble provides the router and other services.
Unlike Central Logger, FEA writes logs to the file system so that they persist after you shut down Finsemble and can help diagnose startup issues. Here are the log locations:
![]() Note: Only the FEA log data persists because it’s written to the file system. If you want to save the data from Central Logger, you must export it.
Note: Only the FEA log data persists because it’s written to the file system. If you want to save the data from Central Logger, you must export it.
Next, take a closer look at your code. The first thing is to verify that the types are specified correctly. Even good developers can make a mistake here.
Another problem you might encounter is race conditions. In any software, these can be difficult and frustrating to diagnose because they can often be intermittent. Sometimes things time out, at other times everything works fine.
In .NET code, companies often use newtonsoft.json. It provides classes that you can use for implementing important services, but it is a third party product, and therefore it isn’t always upgraded. In fact, some companies disallow version 7 as a security policy. . Finsemble requires version 7 or later. Unless you upgrade, we don’t have a good way around it.
In Finsemble, each component that has a window consists of 2 parts, each of which has its own Electron process. One is for the title bar, and the other is for the content of the application. For windowless apps or services, there is only one process because they don’t need a title bar.
Finsemble provides the title bar component for each window. A user can use the title bar to maximize, minimize, or close the window. We also include controls for window management and data sharing. The content pane below the title bar is the actual app you’re working with.
In the Central Logger, these two processes are tracked separately. The title bar process has the name of the app, and the content component process has the same name with the suffix of view-
![]() Caution: Make sure you choose the correct process to debug. It’s unlikely that you will want to troubleshoot the title bar, so remember to always click the view process. Similarly, if you press Ctrl+Shift+I, you might not realize that you accidentally launched the developer tools for the title bar, not for the actual component. For this reason, we recommend that you launch the dev tools from Central Logger.
Caution: Make sure you choose the correct process to debug. It’s unlikely that you will want to troubleshoot the title bar, so remember to always click the view process. Similarly, if you press Ctrl+Shift+I, you might not realize that you accidentally launched the developer tools for the title bar, not for the actual component. For this reason, we recommend that you launch the dev tools from Central Logger.
Each content component has an FSBL object injected into it, allowing you to access all the Finsemble API clients from the javascript console, for example by using FSBL.Clients.LauncherClient.
For the most part, you can think of a service as an invisible window. The biggest difference is that a service component doesn’t have a FSBL object injected into it.
When you implement a service, you must extend the Finsemble base service and configure Finsemble to start your service.
This is easily achieved using the Finsemble CLI tool, and we recommend that you use it where possible. This way, all the HTML, JavaScript, and configuration entries that your service needs to run will automatically be created for you. You invoke the CLI from the command line.
For example, to add a desktop service called my-service:
npx finsemble-cli add service my-service
CLI will do most of the work for you. All that’s left is editing in selected places as needed.
We said earlier that service windows are invisible. In production this is exactly what you want, but while troubleshooting it would be nice to make such windows temporarily visible. You can configure a service window to make it visible by setting the visible property to true. The window won’t display much info, and will be basically black, unless you add a UI to it, but you can press Ctrl+Shift+I to launch the dev tools for the service.
It is also sometimes helpful to delay the startup of the service. You can achieve this by setting the debugServiceDelay to the time delay that you want, in milliseconds:
{
    ...
    "visible": true,
    "showDevConsoleOnVisible": true,
    "debugServiceDelay": 60000,
    ...
}
In our example, we delay the startup of the service for one minute. You can use this time to visit the console and set up some breakpoints that you can use to observe the behavior of the service.
The delay you configure this way overrides the service timeout. So don’t worry about your service timing out while you’re examining the breakpoints. If the delay period isn’t enough, you can always make it longer.
The service window itself might be invisible, but there is no such thing as an invisible service. Every service you create and every service that Finsemble provides can be found in the Central Logger. When you click it, you launch the DevTools for that specific service, where you can also access the source code for that service in the Source tab.
Services often communicate with components and with each other by using the router. For more info, see The Router.
There are two ways you can run HTML5 components in Finsemble:
Let’s focus on the first way, and look at the Component flow. A similar process applies to services. When you build Finsemble, it processes the webpack/webpack.components.js to generate the build. This process reads and merges these files to determine the collection of components to build:
If you create a component from the command line, it defaults to populating the webpack/webpack.components.entries.json file. But you can also manually remove entries and instead create a JSON file right in the component folder with the name finsemble.webpack.json. This file should contain an array of the file paths, relative to the file, to use as build entry points, e.g.:
[
    "index.js"
]
If there are key collisions in these 'entries' files, or the path to your file is incorrect, your component might not get built correctly and might not behave as you would expect. Perhaps it doesn’t bring up visuals or adds nothing to the logs, but might still exist in the menu. To identify this situation after the build, look in public/build/components/{COMPONENT_NAME}/ for a .js file named after your component. If the folder is missing that .js file, the component will not load properly when it is run.
To help you find these collisions, add two lines to the ends of your webpack/webpack.components.js file:
console.log(JSON.stringify(componentsToBuild, null, 2));

console.log(webpackConfig.entry)
Finsemble then writes 2 lists to the build console log. The first one is the list of components it expects to build, and second is the list of components it successfully built. If a key collision occurs, one of the components involved in the collision won’t show up in the second output. Now compare these two lists to find the collision.
![]() Note: When you make changes to the webpack files, a Reload in a running Finsemble is not enough to get it to pick up those changes. You must fully exit from a running Finsemble and then run a fresh build.
Note: When you make changes to the webpack files, a Reload in a running Finsemble is not enough to get it to pick up those changes. You must fully exit from a running Finsemble and then run a fresh build.
![]() Note: if you've just upgraded your Finsemble version, run
Note: if you've just upgraded your Finsemble version, run yarn dev:fresh or npm run dev:fresh to ensure any files cached by the build are recreated.
Open the Central Logger and find your component in the list of running components. Click the one that has “-view” in its name when you hover over it (it is usually the second entry in your component list). That allows you to see the javascript console for that component. Additionally, you can filter the Central Logger down to only show output from that specific component. If you see blocks in red, those are indicative of errors that are likely what is preventing your component from loading properly.
If it shows a URL and error in the component window noting that it cannot load it, then confirm that the URL exists by loading it in your browser and, if the file was built by the Finsemble webpack flow, that the file it is looking for is in the build folder at the expected location. If it is not there, then confirm that you have configured the build correctly for that component (see Debugging the Finsemble webpack flow) and that your configuration includes the correct URL.
If you have config files dedicated to your component in the component’s own folder, then make sure that they are imported by the higher level Finsemble config files (e.g. the importConfig array in public/configs/application/config.json ).
This is most likely because in that context, you are actually getting the console for the component's titlebar and not the console window.
If in the Central Logger you find your component in the list of running components, you will see that its name shows up twice in a row. The first one is usually your component’s titlebar and the next one is usually the actual component. You can confirm which is which by hovering over the component entry in the Central Logger. The component entry will have “-view” at the end of its name while the title bar one doesn’t. Clicking the component will open its console.
There is a recipe branch in our finsemble-seed repo that allows you to add a button to your component title bar that you can click to open up a console right next to that component. The recipe branch is recipes/dev-tools-windowTitleBar-button.
A race condition can occur when code that is trying to access Finsemble API clients gets loaded before the API itself is fully loaded. To avoid this problem, we use the following pattern. This example assumes a React component, but the pattern applies to any javascript framework or application used in Finsemble:
const FSBLReady = () => {
    ReactDOM.render(
        <ExampleOutput />,
        document.getElementById("example-output-div")
    );
};
if (window.FSBL && FSBL.addEventListener) {
    FSBL.addEventListener("onReady", FSBLReady);
} else {
    window.addEventListener("FSBLReady", FSBLReady);
}
![]() Note: there is a similar pattern with FDC3, but in Finsemble version 6 or later it is no longer needed because FDC3 is built into Finsemble and will queue requests to the API until it is ready, automatically.
Note: there is a similar pattern with FDC3, but in Finsemble version 6 or later it is no longer needed because FDC3 is built into Finsemble and will queue requests to the API until it is ready, automatically.
When you group windows together, under certain conditions they might not align correctly and have very small gaps, or one is slightly larger than the others.
This behavior is commonly due to the Windows Display Settings using a non-100% scaling multiplier for your resolution, which can result in rounding errors for window sizes. Ideally, your display scaling setting should be set to 100%, or multiples of it (for example, 200%). Then Finsemble will receive accurate pixel level positioning details from the OS for your component windows.
Most webpack builds process only a single application. But the Finsemble build processes many components, and has been optimized for efficiency. However, it can be affected by CPU and disk performance.
If you experience slow builds, check that the Windows battery settings are set to allow max performance if you are on a laptop. You can confirm this by clicking the battery icon in your task tray and dragging the slider in the pop-up window all the way to 100% for best performance. The default Windows performance setting when using battery power is 50% and can be customized, with settings being preserved between reboots. This can dramatically scale back CPU performance, causing the issues you are observing.
Hosting your project and build folder on a network disk can also adversely affect performance. For best performance, use a folder hosted on a local hard disk.
Ineffective mark-compacts near heap limit Allocation failed - JavaScript heap out of memory error when building the seed projectThis error indicates that webpack needs more memory than is allocated to Node.js. Node's default maximum memory size is 2GB but webpack can sometimes exceed this during multi entry builds (such as when building a large number of components in the seed).
The seed project's (webpack/buildHelpers.js)[https://github.com/ChartIQ/finsemble-seed/blob/master/webpack/buildHelpers.js] file includes the line env.NODE_OPTIONS="--max-old-space-size=4096" which raises Node's default memory limit to 4GB. If you are encountering an "out of memory" error then you may have an older version of this file that is missing this line, or you may need to adjust this value higher than 4GB. You can choose any value (it does not need to be an even increment) and there is no serious penalty to setting too high a limit because Node will only claim the memory it needs and will release memory that it doesn't use.
If you see this error, then either a JavaScript preload or script tag might be missing (server 404 error) or it is being served without the correct character set. If this error occurs in an html page, try including in the HEAD tag of your HTML.
npm install I get many errors and messages about locks or permissionsSome versions of npm have a bug that allows for a race condition to occur when installing dependencies. When multiple packages are downloaded and installed at the same time, they could try to write to the same file or location, which throws these errors. We recommend that you either upgrade to a later npm version or use yarn instead.
My coworker and I run the same code but it looks differentIt can happen that 2 people run the same dev build and both have the same code, but you can see differences in the running Finsemble instances on the machines. This can be due to caching issues in the build.
Sometimes the build caches don’t clear properly for a variety of reasons, and so one cache cleared but the other one didn’t. As a result, you think both machines run the same code but they actually don’t.
To resolve this issue, shut down Finsemble and delete the .webpack-file-cache, dist, finsemble, and node_modules folders from your root Finsemble codebase local directory. Then run yarn install and after that completes, run yarn dev. Do this on both computers, unless it is very clear one is the source of truth and one is off base from it. In this case only the machine that is off likely needs to be cleaned and restarted.
![]() Tip: You can delete the folders faster if you use the command line or Windows Explorer than deleting them in your IDE. This is particularly helpful for node_modules which can be quite large in both size and file count.
Tip: You can delete the folders faster if you use the command line or Windows Explorer than deleting them in your IDE. This is particularly helpful for node_modules which can be quite large in both size and file count.
If these steps don’t resolve the issue, the next level up from that is more extreme and nearly always can be avoided. That is to delete the cache that your running Finsemble uses.
![]() Note:
Note:
To delete the cache:
“%appdata%” into the path. Unless you have changed your settings, this will likely bring you to C:\Users{USERNAME}\AppData\Roaming.yarn start again and see if that resolves the issue.This can happen when you’re using third-party plugins and theming libraries, particularly DevExpress.
To prevent a DevExpress theme from being applied to the title bar, set the property dxc:ThemeManager.ThemeName="None" in the application’s xaml file, e.g.:
<Finsemble:WPFWindowTitleBar x:Name="FinsembleHeader" Height="25" VerticalAlignment="Top" Margin="0" Loaded="FinsembleHeader_Loaded" **dxc:ThemeManager.ThemeName="None"** />
Sometimes it is helpful to know the details of the component opening or closing. Unfortunately this isn’t the information that the Central Logger collects.
Currently we don’t have an event that fires when a specific component is launched. But you can retrieve a list of currently open windows with FSBL.Clients.LauncherClient.getActiveDescriptors. If you do it this way, you have to poll this API to know when components have been launched or closed.
Another possibility is to use WorkspaceEvents. which provides workspace state information instead of info about individual components. You can use this to get the workspace state, its components and use the getActiveDescriptors to find out whether a given workspace component has loaded.
Another option is to create a preload that transmits a router message when a window is launched or closed. To do so, you add a window event listener by using the finsembleWindow.addEventListener. Note that this API is experimental, which means that it might change in the future.
The list of the relevant window event names for components being closed are:
closedclose-requestedclose-completecomponent-state-changed (for evergreen components)If you tried our suggestions and you still can’t resolve your issue, it’s time to contact the Finsemble support team. To help us help you, gather as much information as you can. Follow these steps:

Launch the Central Logger.
Click the "Finsemble Support" button. This toggles the settings to capture a broad range of log levels.
Click "Clear Data" to start fresh.
Try to recreate the problem that you were experiencing. If gathering logs for a start-up problem, restart Finsemble to see if the error occurs.
If the problem occurred, save the log by clicking "Export Log."
Most log files are large. Zip the log files to compress them before sending them to Cosaic.
Email the log file to support@finsemble.com. Please include a detailed description of the problem you're experiencing in your email so that we can properly diagnose the problem.
![]() Important: This detailed logging level might introduce performance issues to your Finsemble application. After you're done debugging, it's best reduce the logging levels to their default state. To reset the log settings back to their original values, click the "Default" button under Quick Views.
Important: This detailed logging level might introduce performance issues to your Finsemble application. After you're done debugging, it's best reduce the logging levels to their default state. To reset the log settings back to their original values, click the "Default" button under Quick Views.
For more information about diagnosing issues so you can iterate quickly, check out Debugging Finsemble.